High Performance Go Profiling
profile your program
If you already know that some functions are slow, you can do benchmark on them. But in most sences, we don’t know why the whole program is too slow. So we need the new X-ray mechine come to help, this is the pprof tool set.
1. what is pprof?
“Package pprof writes runtime profiling data in the format expected by the pprof visualization tool.” this is the definition of runtime/pprof package in godoc. pprof contains two part:
- runtime/pprof packages build into every Go program
- go tool pprof for investigating profiles
2. type of profiles
2.1 CPU profiling
CPU profiling is the most common type of profile. When it is enabled, the runtime of the program will stop every 10 ms to record the stack trace of each current running goroutine. We can locate the hostest code paths after profiling finish. The more time a function appears in the profile, the more time that code path is taking as a percentage of the total runtime.
2.2 Memory profiling
Memory profiling only track the stack trace when heap memory allocations is made, it does not track the stack memory allocations. Just like CPU profiling, it is smaple based. When the runtime meet 1000 heap allocations, it do a sample. So, memory profiling just catch a glimpse of the memory usage in your programming’s full life, you can’t get a full view. It can’t find memory leaks!!!
2.3 Block profiling
When you finished CPU and Memory profiling and eliminated all the CPU and Memory bottlenecks of your program, but the program is till too slow. There maybe some blocks in your program. It’s the time to call block profiling to rescure.
Blockings include:
- sending to a unbuffered channel, but the channel alreay have a element; receiving on a unbuffered channel, but the channle have no element;
- sending to fulled channel, recving from empty channel;
- try to lock on sync.Mutex which is locking by other go routine;
2.4 Mutex profiling
Mutex profiling record how many time can be saved of the Lock contention was removed.
3. action on profiling
3.1 an introducting word-count program
First, let’s write a word counting program, which count all the worlds in a file. The word is defined as all letters bettween two adjacent spaces.
package main

import (
	"bufio"
	"fmt"
	"io"
	"log"
	"os"
	"unicode"

	"github.com/pkg/profile"
)

func readbyte(r io.Reader) (rune, error) {
	var buf [1]byte
	_, err := r.Read(buf[:])
	return rune(buf[0]), err
}

func main() {
	defer profile.Start(profile.CPUProfile, profile.ProfilePath(".")).Stop()

	f, err := os.Open(os.Args[1])
	if err != nil {
		log.Fatalf("could not open %v: %v", os.Args[1], err)
	}

	words := 0
	inword := false
	b := bufio.NewReader(f)
	for {
		r, err := readbyte(b)
		if err == io.EOF {
			break
		}

		if err != nil {
			log.Fatalf("could not read file %v: %v", os.Args[1], err)
		}

		if unicode.IsSpace(r) && inword {
			words++
			inword = false
		}
		inword = unicode.IsLetter(r)
	}

	fmt.Printf("%v: %v words\n", os.Args[1], words)
}
build out the progam and count the bible book:
$ time ./profiling bible.txt
2020/05/24 08:07:12 profile: cpu profiling enabled, cpu.pprof
bible.txt: 669274 words
2020/05/24 08:07:12 profile: cpu profiling disabled, cpu.pprof

real	0m0.318s
user	0m0.126s
sys	0m0.016s
compare with the system cmd wc:
$ time wc -w bible.txt
  824192 bible.txt

real	0m0.024s
user	0m0.019s
sys	0m0.004s
we can see wc is much faster than my program, so we want to know why this program is such slow. It is time to profile!!
3.2 cpu profiling
use go tool pprof to analyse the cpu.pprof file:
go tool pprof cpu.pprof
Type: cpu
Time: May 24, 2020 at 8:07am (CST)
Duration: 304.12ms, Total samples = 110ms (36.17%)
Entering interactive mode (type "help" for commands, "o" for options)
(pprof) top
Showing nodes accounting for 110ms, 100% of 110ms total
Showing top 10 nodes out of 27
      flat  flat%   sum%        cum   cum%
      40ms 36.36% 36.36%       40ms 36.36%  runtime.mallocgc
      40ms 36.36% 72.73%       40ms 36.36%  syscall.syscall
      20ms 18.18% 90.91%       20ms 18.18%  runtime.madvise
      10ms  9.09%   100%       10ms  9.09%  runtime.pthread_cond_signal
         0     0%   100%       40ms 36.36%  bufio.(*Reader).Read
         0     0%   100%       40ms 36.36%  internal/poll.(*FD).Read
         0     0%   100%       80ms 72.73%  main.main
         0     0%   100%       80ms 72.73%  main.readbyte
         0     0%   100%       40ms 36.36%  os.(*File).Read
         0     0%   100%       40ms 36.36%  os.(*File).read
the top command show that 36% of the time this program spends on syscall.syscall; and another 36% spends on gc; we can also view the profiling result on a web page:
go tool pprof -http=:8080 cpu.pprof
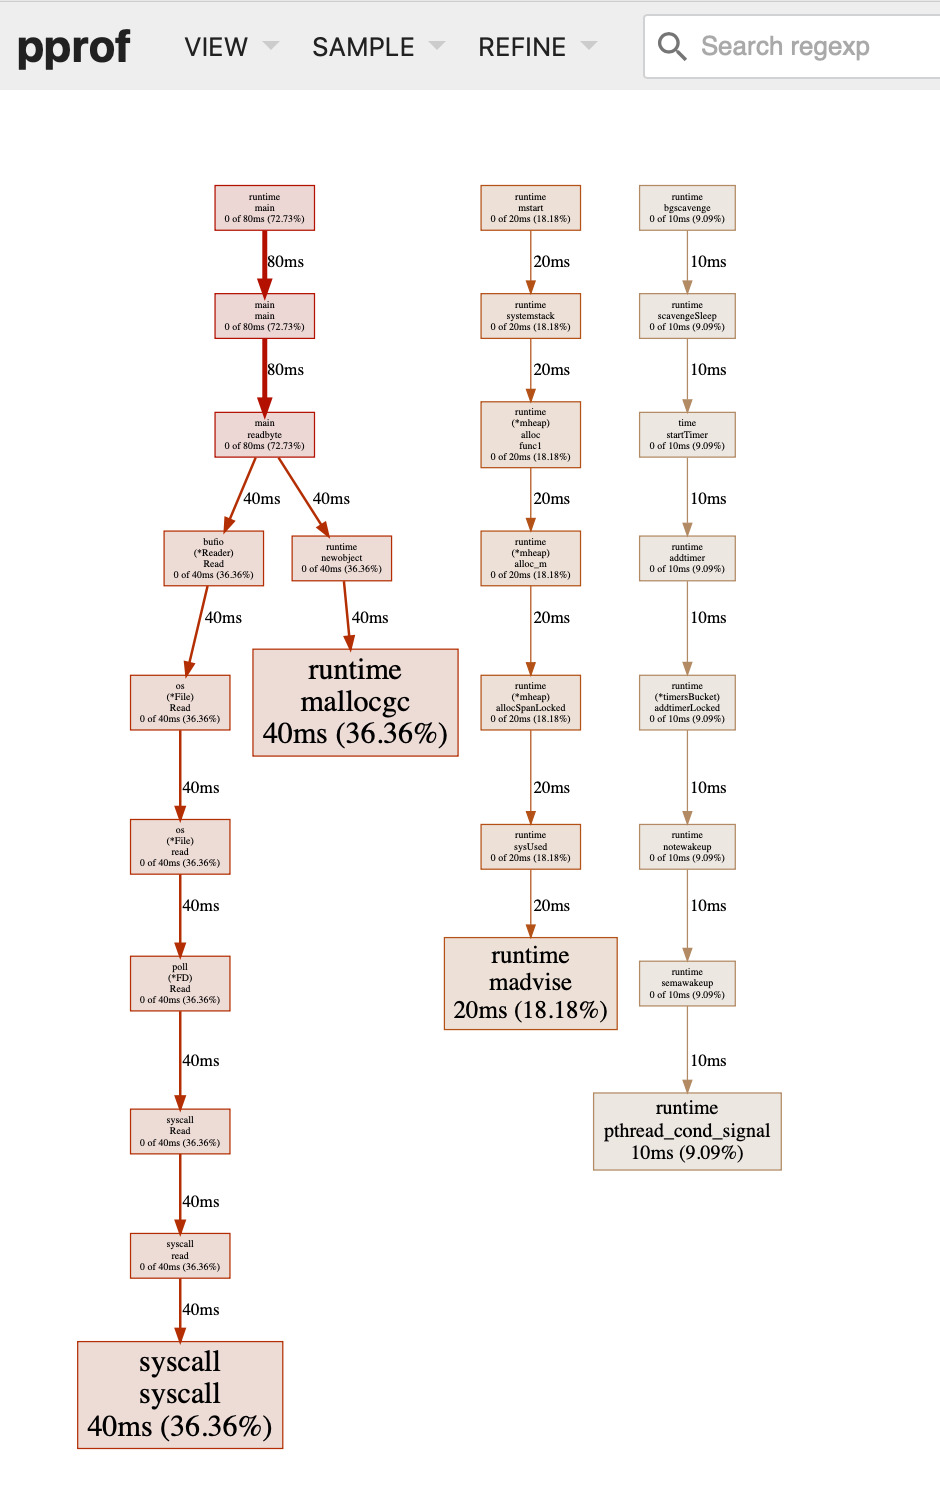
Fig 1. inspect cpu file on web page
The web page is more vivid, the largest box consumes the most CPU time. The syscall. syscall is the largest box. Beacause we call readbyte for each character in the file, so when the file have a lot of characters, we do lots of system calls. And, Finally, the systems calls is very expensive!!
we use bufio’s ReadRune() instead of our readbyte function:
b := bufio.NewReader(f)
for {
	r, _, err := b.ReadRune()
	if err == io.EOF {
	break
}
the new web graph is:
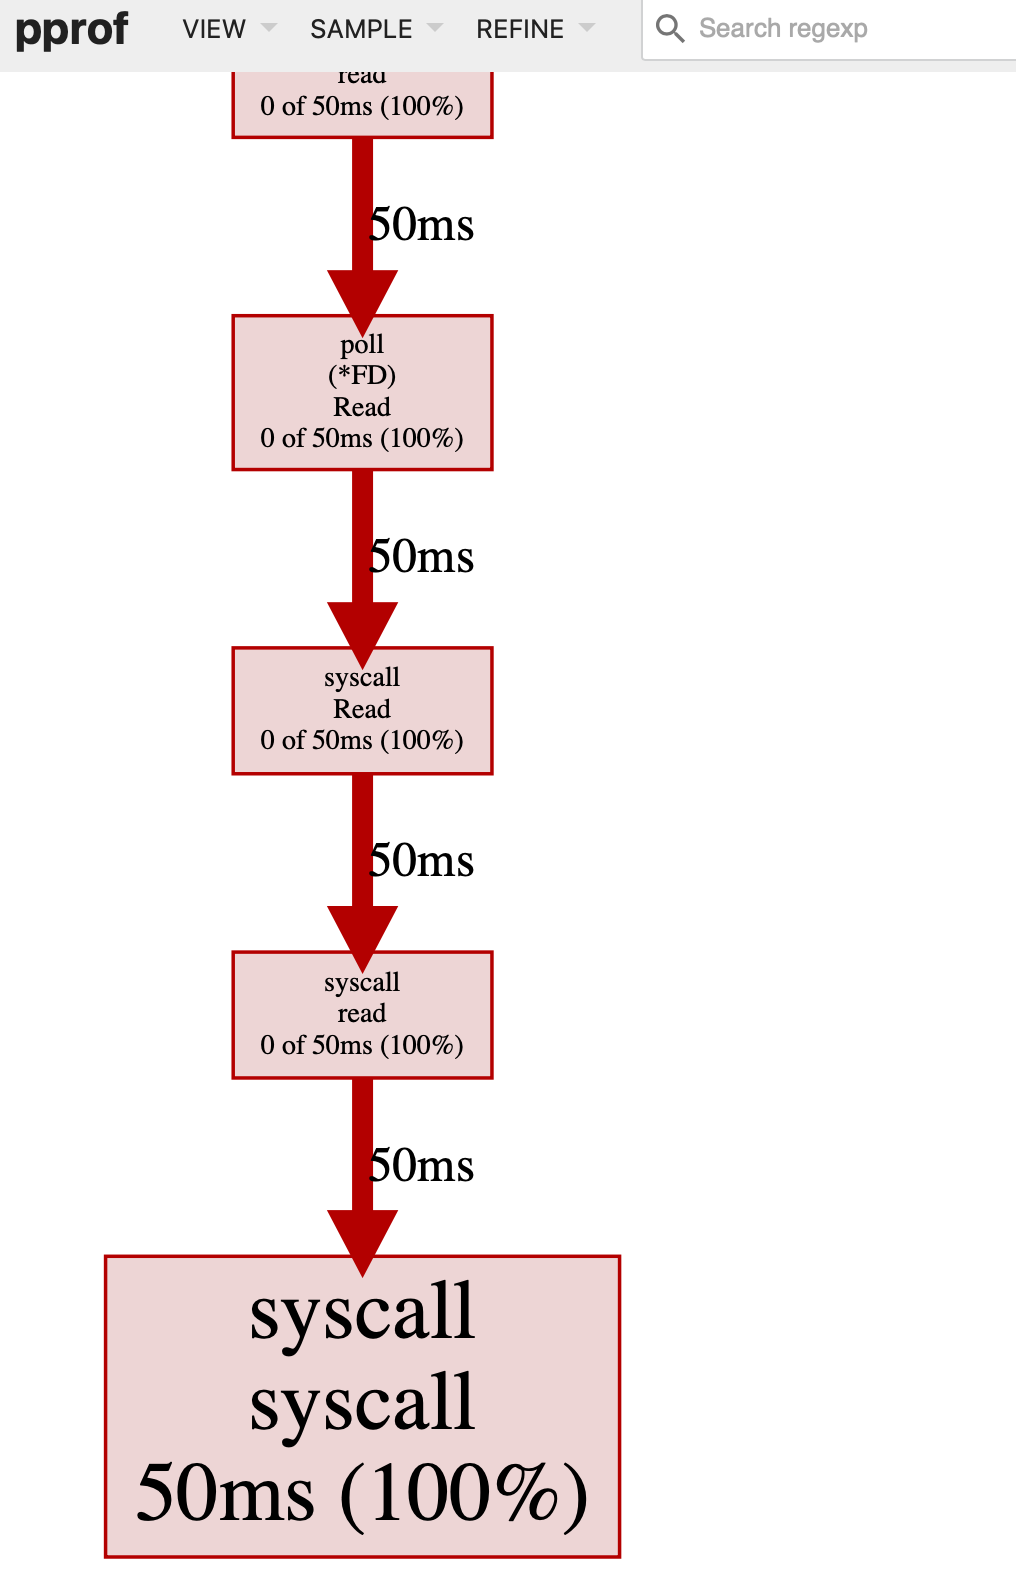
Fig 2. use ReadRune instead of readbyte
We can see when we use the ReadRune, the GC time consumption disappears, and the total time consumed is smaller than the original version. But just as the new web graph shows, the syscall.syscall still cosumes the most time.
We can read a block of characters in one system call thus reduce the total system calls during read the file. first we set the read block size as 1K(1024 Bytes):
var bytes [1024]byte
b := bufio.NewReader(f)
for {
	n, err := b.Read(bytes[:])
	if err == io.EOF {
		break
	}

	if err != nil {
		log.Fatalf("could not read file %v: %v", os.Args[1], err)
	}

	for i := 0; i < n; i++ {
	if unicode.IsSpace(rune(bytes[i])) && inword {
		words++
		inword = false
		}
		inword = unicode.IsLetter(rune(bytes[i]))
	}
}
now the syscall time cosumption is much smaller:
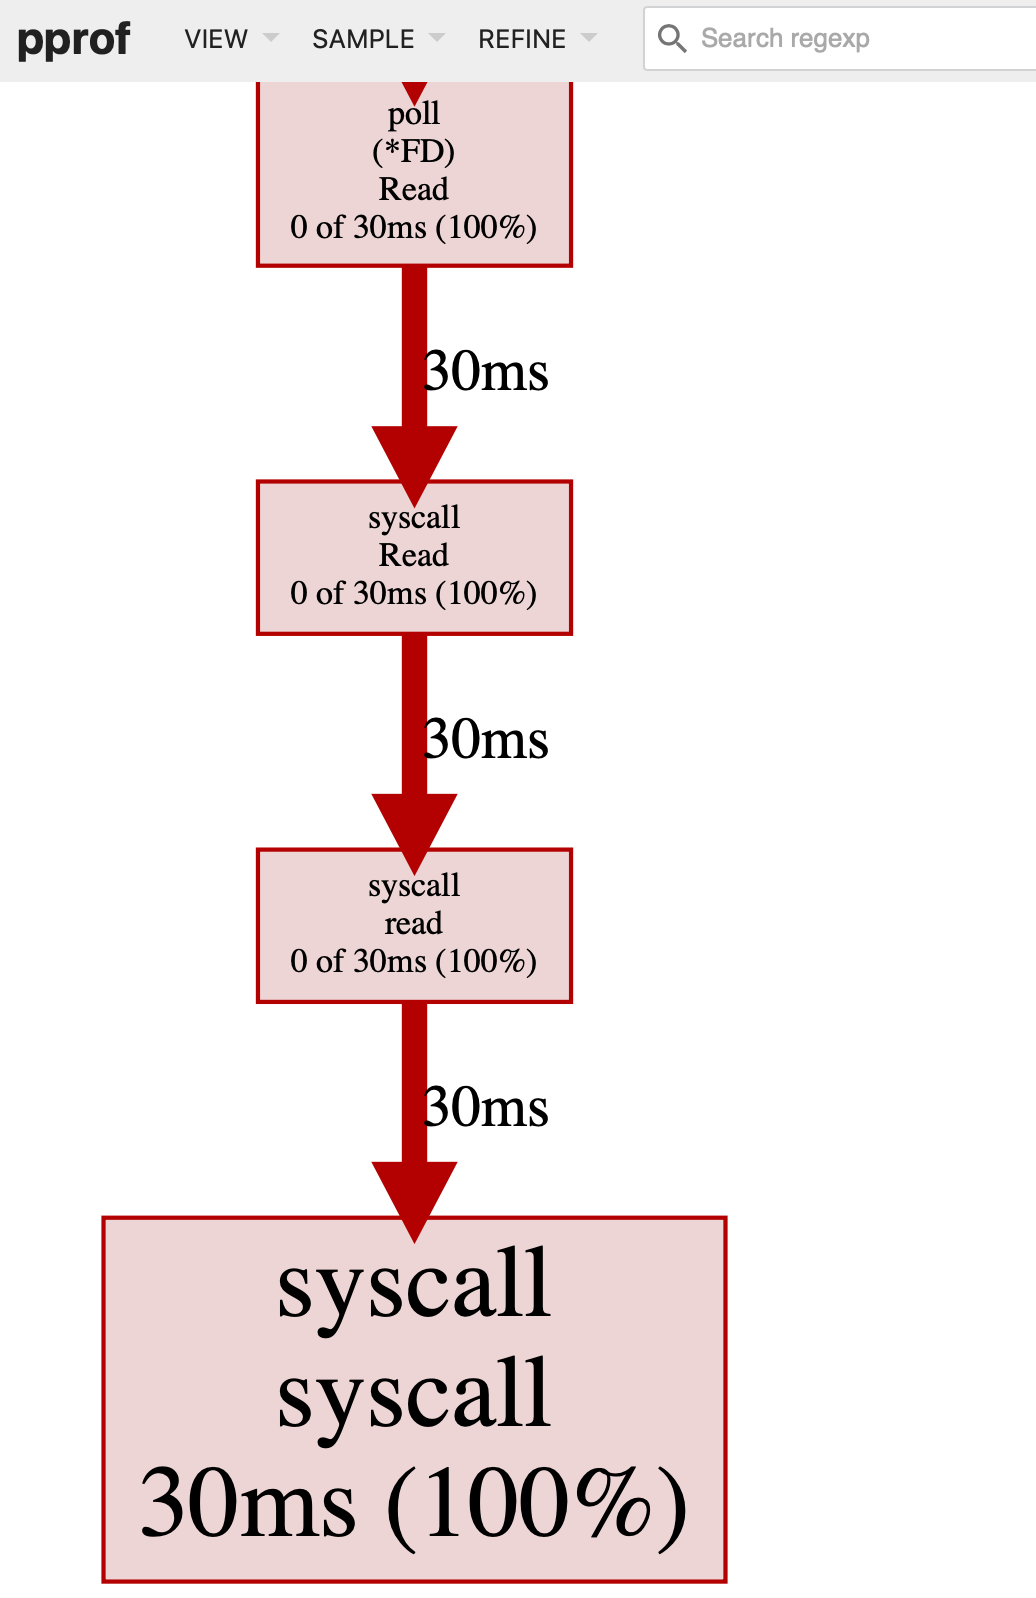
Fig 3. when read buffer size is 1024 Bytes
3.2 memory profiling
let’s inspect the code of our readbyte function:
func readbyte(r io.Reader) (rune, error) {
	var buf [1]byte
	_, err := r.Read(buf[:])
	return rune(buf[0]), err
}
every time we call this function, it will allocate 1 byte array on heap; we do a memroy profile:
defer profile.Start(profile.MemProfile, profile.ProfilePath(".")).Stop()
the web graph:
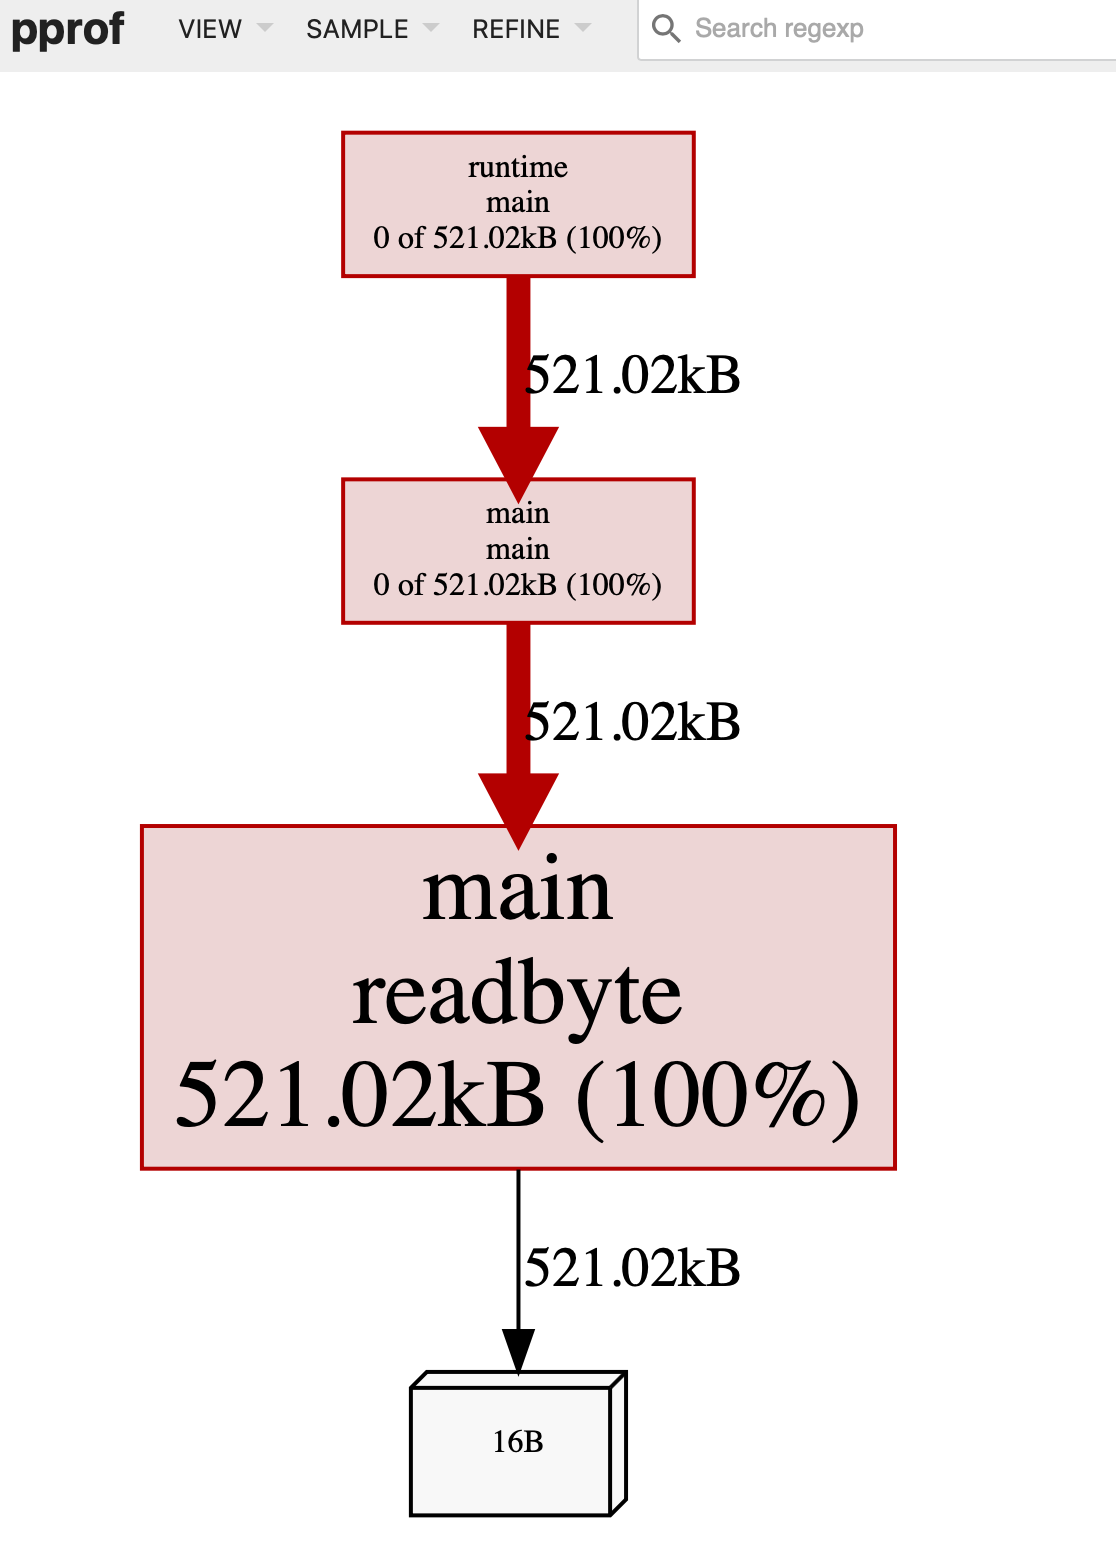
Fig 4. memory profiling when use raw readbyte we can see that all memeory allocation happens in readbyte.
we can reduce the allocation by pre-alloc:
var buf [1]byte

func readbyte(r io.Reader) (rune, error) {
	_, err := r.Read(buf[:])
	return rune(buf[0]), err
}
the block profiling and mutex profiling is belong to yourself. I will finish now!:) happy profiling!