High Performance Go Tracing
execution tracer
The execution tracer is integrated into the Go runtime, it does know what a go program is doing at a particular point in time.
1. an introduction example - mandelbrot generator
The github address: https://github.com/campoy/mandelbrot.git, input the following commands in your shell, finally will bron a mandelbrot.png, which is a 1024 * 1024 picture.
 git clone https://github.com/campoy/mandelbrot.git
 cd mandelbrot
 git mod init mandelbrot
 go build -o md && ./md
 Fig 1. generated mandelbrot.png
But how long it takes to generate this picture?
 $ time ./mb

 real	0m3.842s
 user	0m3.848s
 sys	0m0.004s
2. profile the generator
pprof.StartCPUProfile(os.Stdout)
defer pprof.StopCPUProfile()
add the privious code to the start of the main function of the generator; then
go build -o mb && ./mb > cpu.pprof
then analysing the cpu profile:
go tool pprof -http=:8080 cpu.pprof
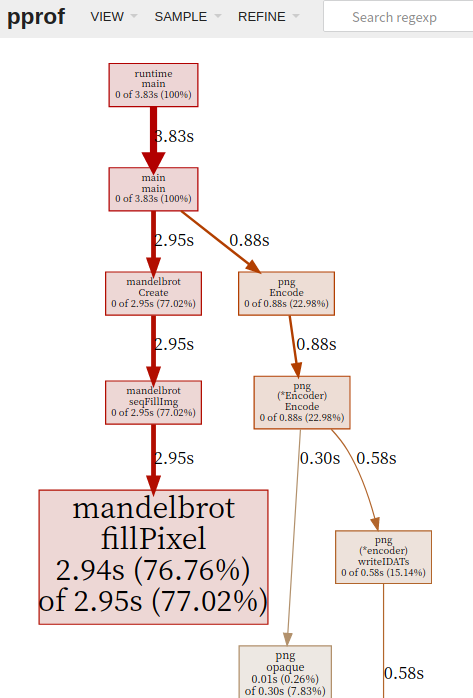 Fig 2. web pprof mandelbrot program
From the graph, we can conclude that main.fillPixel is actually doing most of the work.
3. tracing a program
From the pprof result, we only know main.fillPixel doing the most work. But there are some hidden action happen beneath the program. What actions the goroutines did? The normal/block time of a goroutine? When the goroutine is blocked and Where the block happen? How GC influence the goroutine execution? We dig into a simple tracing example:
An example program:
 package main

 import (
	 "os"
	 "runtime/trace"
 )

 func main() {
	 trace.Start(os.Stdout)
	 defer trace.Stop()

	 ch := make(chan string)
	 go func() {
		 ch <- "HJIANG"
	 }()

	 <-ch
 }
Generate tracing file and open tracer window:
 $go build && ./tracer > trace.out
 $go tool trace trace.out
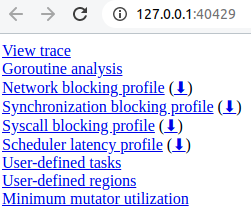
Fig 3. tracing web window
3.1 Inspect Sheduler latency profile:
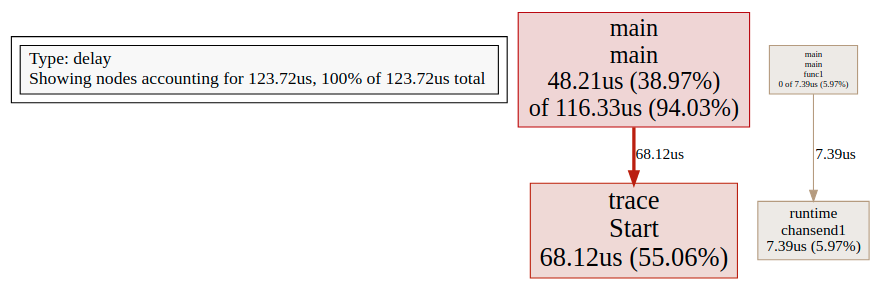
Fig 4. scheduler delay
Our simple program just do a channel insert and tracing. The previous graph show the schedule delay of these two operations.
3.2 goroutine analysis
From the “goroutine analysis”, we know how many gorutines created and running in a function block. For each goroutine, we can inspect its running messages:
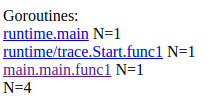 Fig 5. go routine analysis window
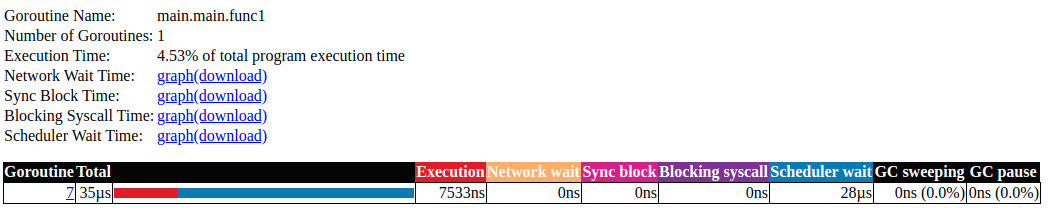 Fig 6. Info of a specific goroutine
3.3 View trace
A trace view example:
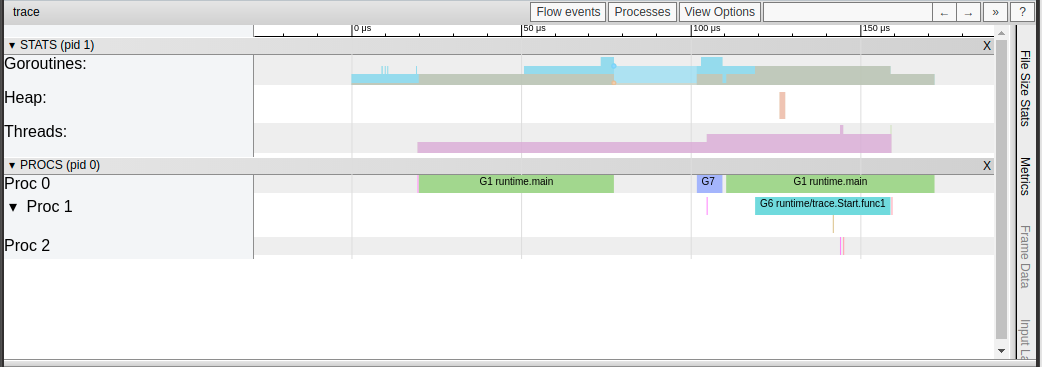 Fig 7. a trace view web page(must use chrome)
Tips:
- The ruler in the first line is the time line, we can see routines start at 0 us and end at 171.871 us.
- Goroutines: record the infomations of goroutines during the program lifetime, goroutine start and end time. At a time stamp, the infomation is:
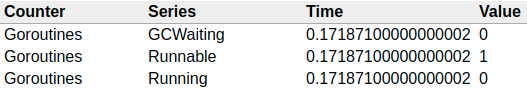 Fig 8. goroutine info
- Heap: the memory usage info during the program lifetime.
- Tread: the OS thread info during the program lifetime.
- Proc: virtual processor info during the program lifetime
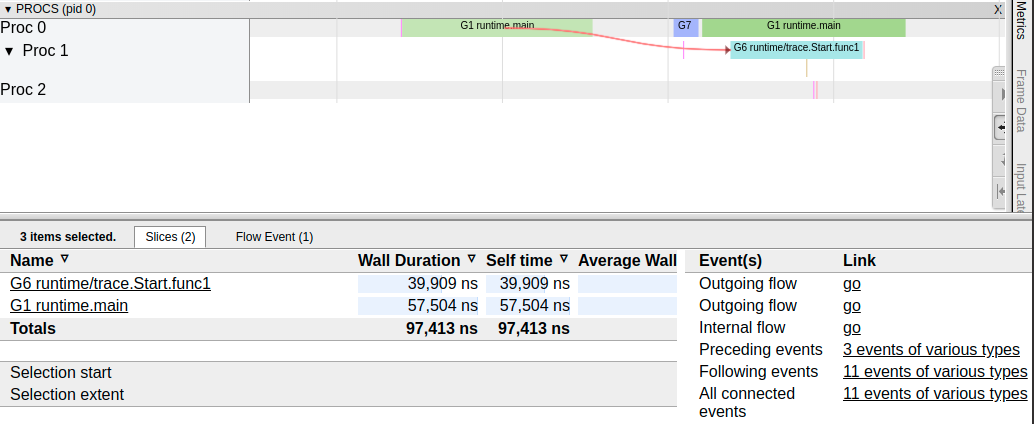
3.4 view events
4. End
Now, do some tracing yourself, and find more useful things in your program!:)