High Performance Go Gc
Go GC
Go is a GC language, this is the design principle and never change. We want to know how our program use memory, and when GC performance is the bottleneck, how we deal with it.
1. GC world view and design change
GC will give the program an illusion, that it may have infinite amount of memory available to use. And over the time, Go GC has moved from a pure stop the world collector to a concurrent, non compacting collector. And the big picture is that –Go GC favors low_latency over maximum_throughput.
The time line of Go GC design change:
- Go 1.0, stop the world mark sweep collector based heavily on tcmalloc.
- Go 1.3, fully precise collector, wouldn’t mistake big numbers on the heap for pointers, thus leaking memory.
- Go 1.5, new GC design, focusing on latency over throughput.
- Go 1.6, GC improvements, handling larger heaps with lower latency.
- Go 1.7, small GC improvements, mainly refactoring.
- Go 1.8, further work to reduce STW times, now down to the 100 microsecond range.
- Go 1.10+, move away from pure cooprerative goroutine scheduling to lower the latency when triggering a full GC cycle.
- Go 1.13 Scavenger rewritten
2. Tune GC
There is a environment variable GOGC, and the formula for GOGC is:
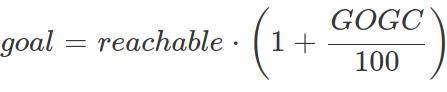
Fig 1. GOGC formula
For example, we have 256MB heap, and GOGC = 50; when heap size grow bigger than: 256MB * 1.5 = 384MB, the GC will start to work. We can conclude:
- when GOGC is big, the pressure of GC is small.
- when GOGC is small, the pressure of GC is big.
3. How to monitoring the GC
3.1 use GODEBUG=gctrace=1
A simple way is to enable the output of GC logging, by setting the GODEBUG envir -onment variable.
$env GODEBUG=gctrace=1 godoc -http=:8080 -goroot /usr/lib/go-1.14
The privious command set gctrace on when running godoc program. The GC logging is:
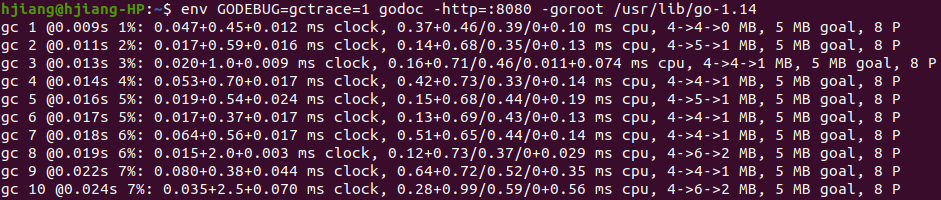
Fig 2. GC logging
Search document of runtime package get: gc # @#s #%: #+#+# ms clock, #+#/#/#+# ms cpu, #->#-># MB, # MB goal, # P where the fields are as follows:
- gc # the GC number, incremented at each GC
- @#s time in seconds since program start
- #% percentage of time spent in GC since program start
- #+…+# wall-clock/CPU times for the phases of the GC
- #->#-># MB heap size at GC start, at GC end, and live heap
- # MB goal goal heap size
- # P number of processors used
When you know your program has a GC problem, use GODEBUG=gctrace=1 is a good way, but for general telemetry the “net/http/pprof” is much useful.
3.2 use net/http/pprof
We use a simple program to demonstrate how to use net/http/pprof, and why it is a holy grail to monitor your online program:
package main

import (
	"fmt"
	"net/http"
	_ "net/http/pprof"
)

func main() {
	ip := "0.0.0.0:6060"
	if err := http.ListenAndServe(ip, nil); err != nil {
		fmt.Println("start pprof failed on %s\n", ip)
	}
}
$go run test_gc.go
Running the program, and open a http://localhost:6060/debug/pprof/ in your favourite web browser. you will get a window like this:
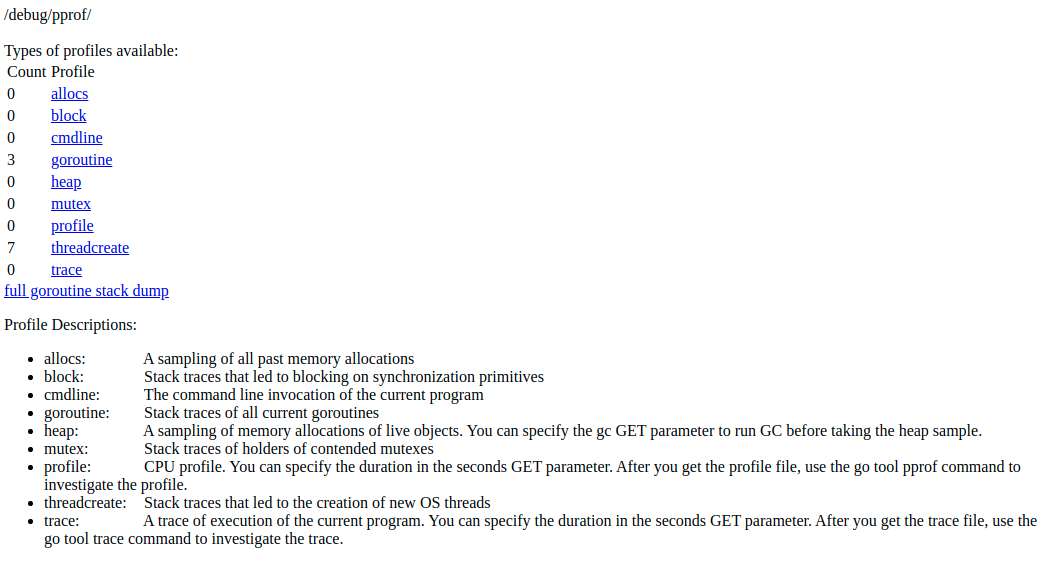
Fig 3. net/http/pprof web page
Use command line get profile message:
- download cpu profile:
- go tool pprof http://localhost:6060/debug/pprof/profile # 30-second CPU profile
- go tool pprof http://localhost:6060/debug/pprof/profile?seconds=120 # wait 120s
- download heap profile:
- go tool pprof http://localhost:6060/debug/pprof/heap
- download goroutine profile:
- go tool pprof http://localhost:6060/debug/pprof/goroutine
- download block profile:
- go tool pprof http://localhost:6060/debug/pprof/block
- download mutex profile
- go tool pprof http://localhost:6060/debug/pprof/mutex
4. Tech to minimise memory allocation
- strings vs []bytes
Avoid []byte and string conversions whenever possible. But why? In Go []byte is mutable, string is immutable. Most programs prefer to work with string, but most IO is done with []byte. when you really want to convert []byte to string, use slicebytetostringtmp in runtime/string.h. - using []byte as map key
- avoid string concatenation
- don’t force allocations on the caller of your API
- preallocate slices if the length is known Append pattern can copy a lot of data and creating a lot of garbage.
- reuse common objects using sync.Pool
- be careful about padding and alignment of struct
I don’t want talk too much about the detail tech to minimise memory allocation, so it’s up to you to dig into the big world:), good luck!!!